METEODECK ANLEITUNG
Wetter vergleichen,
Unterschiede erkennen.
MeteoDeck legt stündliche Vorhersagen mehrerer Orte auf eine gemeinsame Zeitachse. Diese Anleitung erklärt die Ansichten, Wettermodelle und wichtigsten Funktionen.
01 SCHNELLSTART
In drei Schritten zum Vergleich
- Orte wählen.Suche nach Stadt oder Postleitzahl und füge bis zu fünf Orte hinzu.
- Modell und Zeitraum festlegen.Nutze Best Match oder wähle DWD ICON, ECMWF IFS beziehungsweise NOAA GFS für drei, sieben oder zehn Tage.
- Ansicht auswählen.Wechsle zwischen Übersicht, Vergleich, Temperatur, Sonne, Niederschlag, Wolken und Wind.
BEISPIEL · ZWEI ORTSAUSWAHLEN
Asienreise und Familie getrennt speichern
- Reiseziele zusammenstellenEntferne die aktuellen Orte und füge Seoul, Tokyo und Osaka über die Ortssuche hinzu.
- Erste Auswahl speichernÖffne Einstellungen, gehe zu Ortsauswahlen und klicke auf Als neue speichern. MeteoDeck speichert sie als „Seoul · Tokyo · Osaka“.
- Familienorte zusammenstellenEntferne die Reiseziele, füge die Wohnorte deiner Familie hinzu und klicke erneut auf Als neue speichern.
- Zwischen beiden wechselnÜber die nummerierten Schaltflächen bei „Orte“ wechselst du mit einem Klick zwischen Reise und Familie. Der Stern öffnet die Verwaltung; Änderungen speichern aktualisiert die gerade aktive Auswahl.
Du kannst bis zu fünf Ortsauswahlen speichern. Sie bleiben ausschließlich im lokalen Speicher dieses Browsers.
02 ALLE TABS
Sieben Ansichten für unterschiedliche Fragen
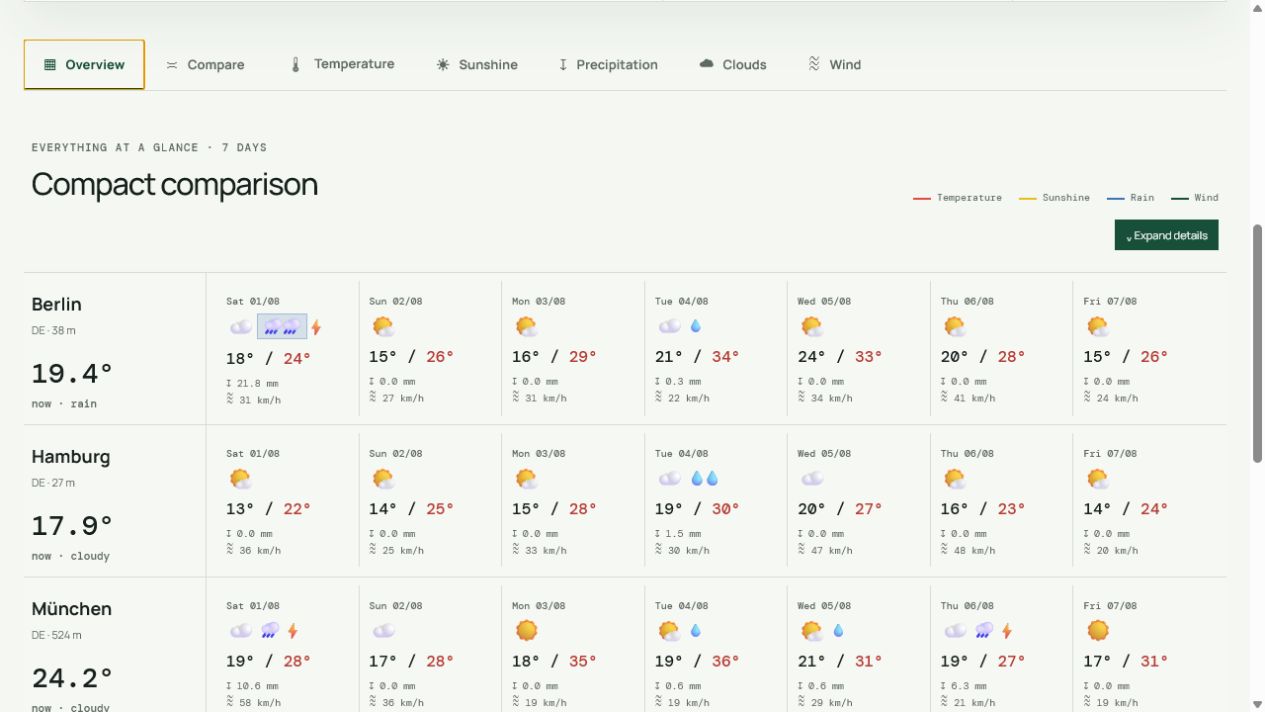
Übersicht
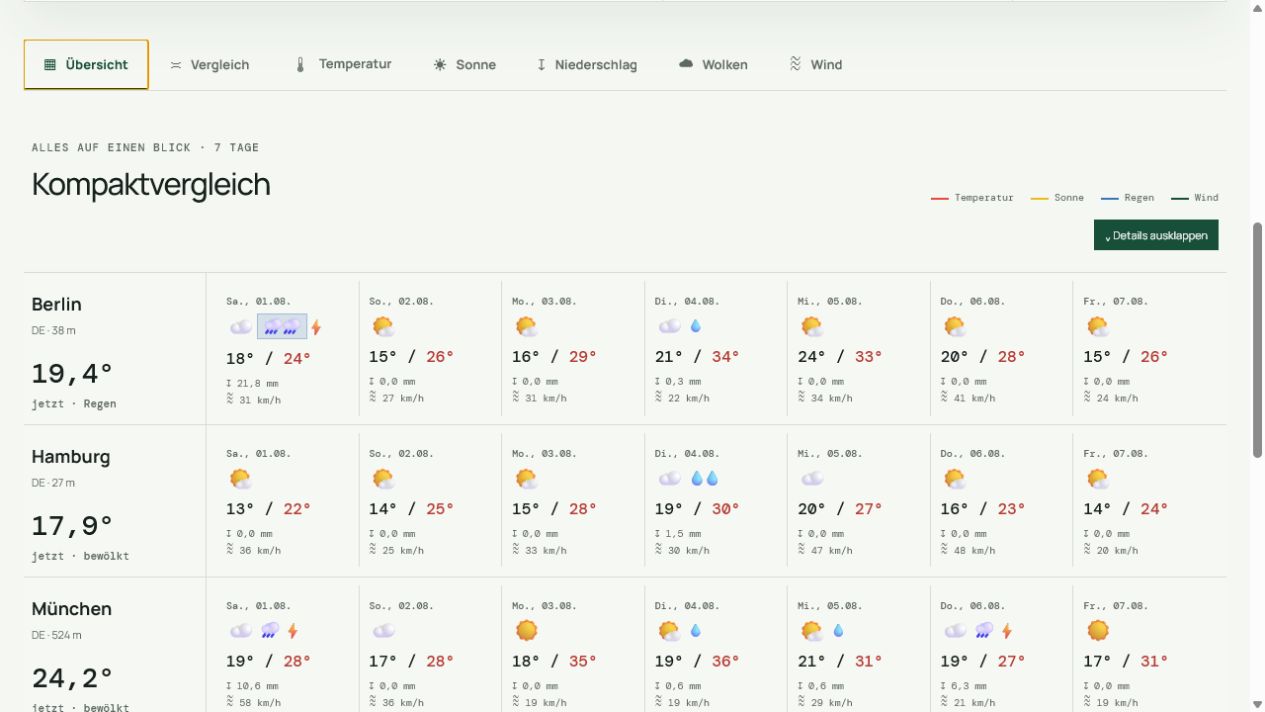
Fasst die wichtigsten Tageswerte aller gewählten Orte zusammen. Pro Tag siehst du Wetterlage, Mindest- und Höchsttemperatur, Niederschlagsmenge und maximalen Wind. Die Detaildarstellung lässt sich ein- oder ausklappen.
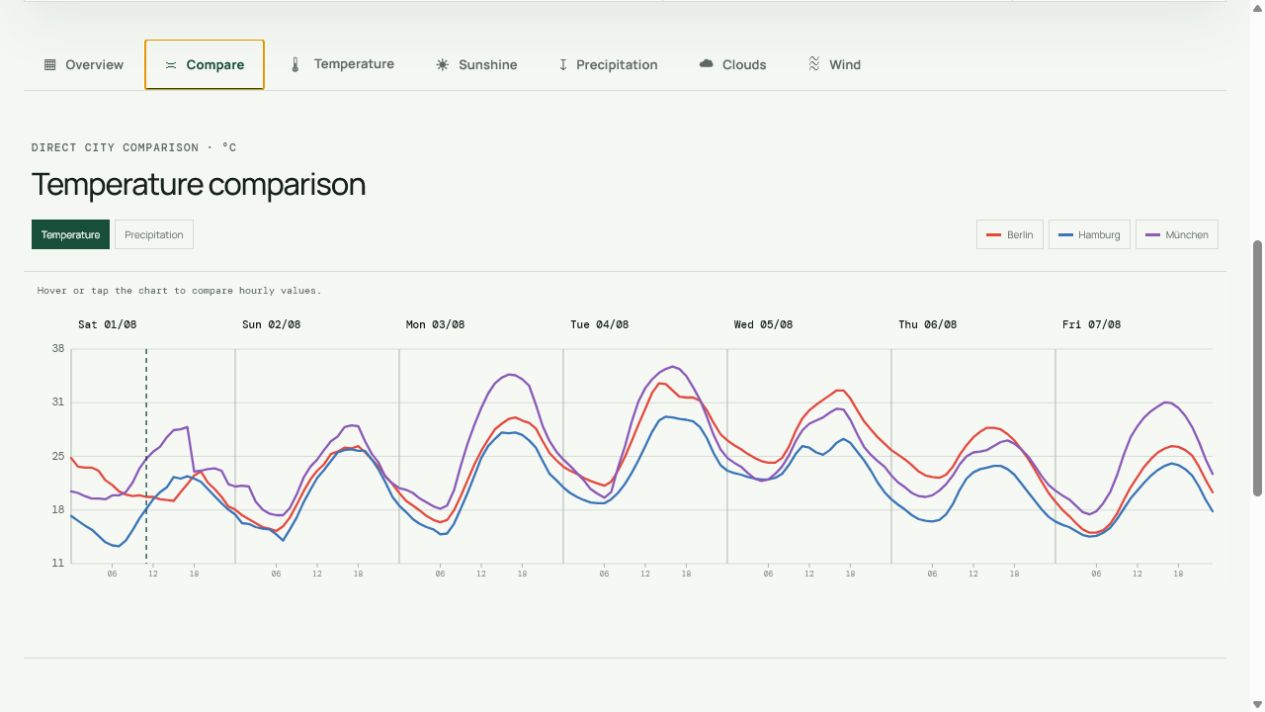
Vergleich
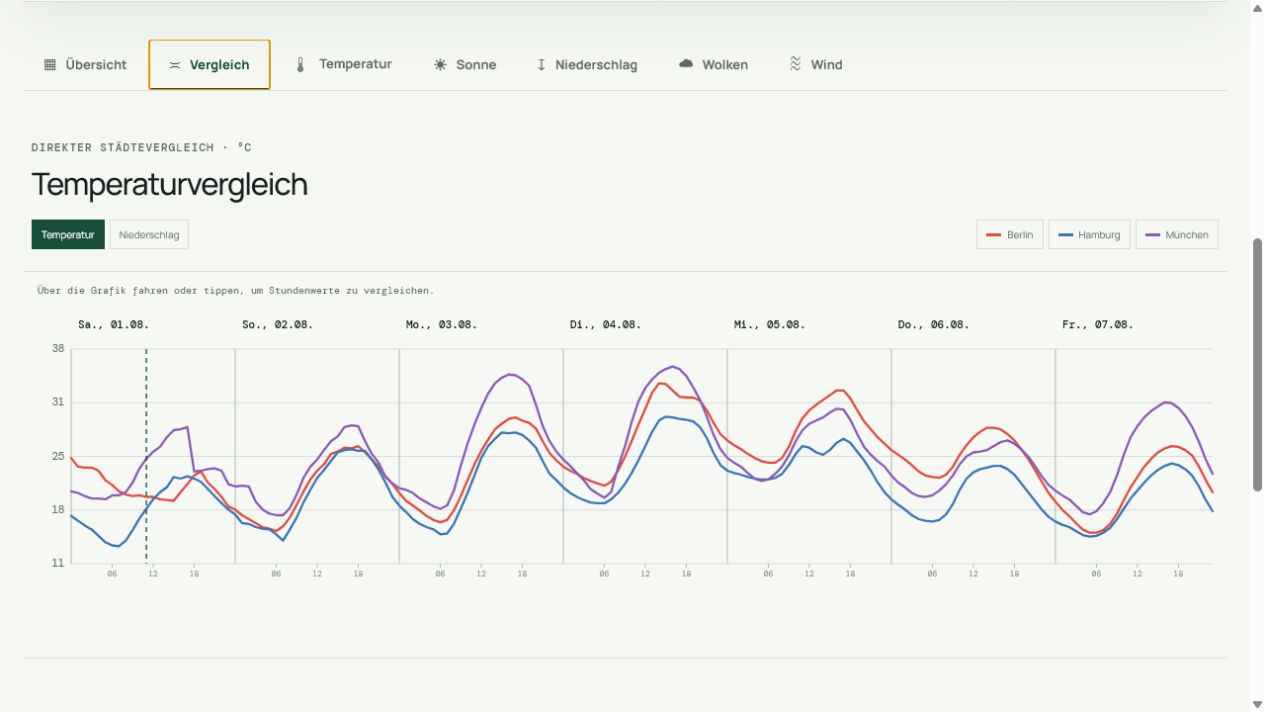
Legt die Kurven mehrerer Städte direkt übereinander. Du kannst zwischen Temperatur und Niederschlag wechseln, einzelne Orte ausblenden und Werte für denselben Zeitpunkt unmittelbar vergleichen.
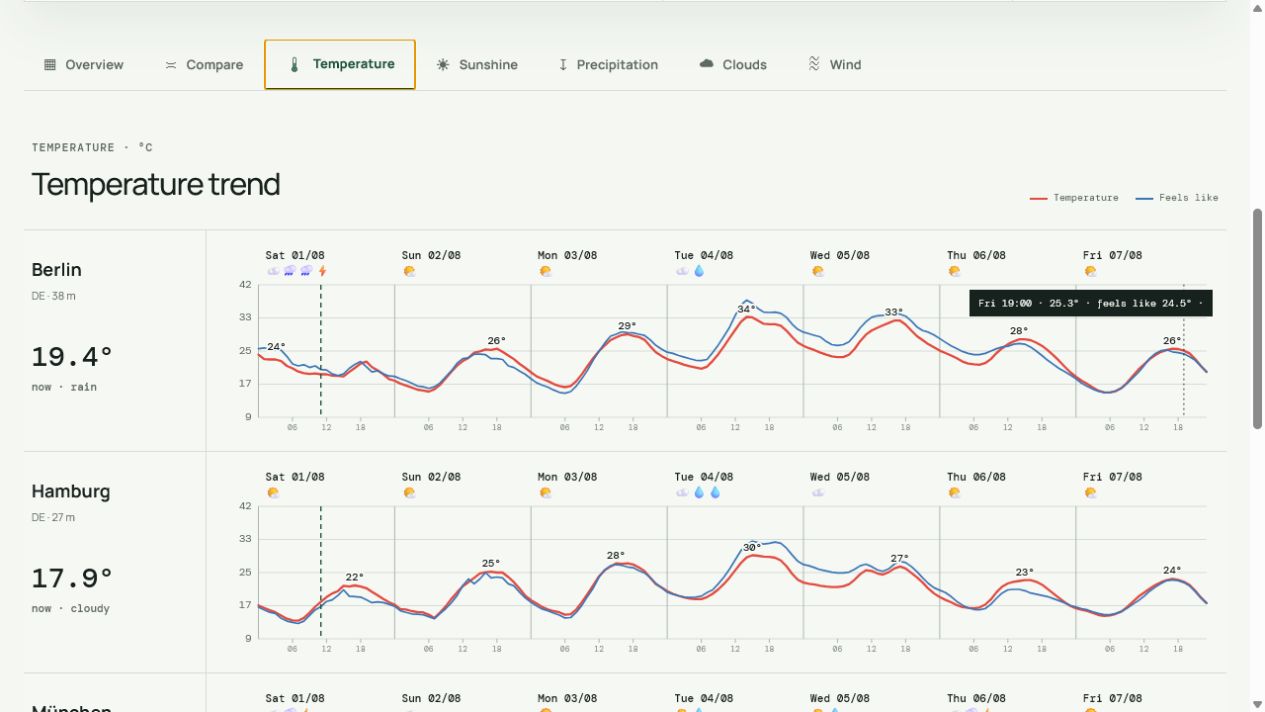
Temperatur
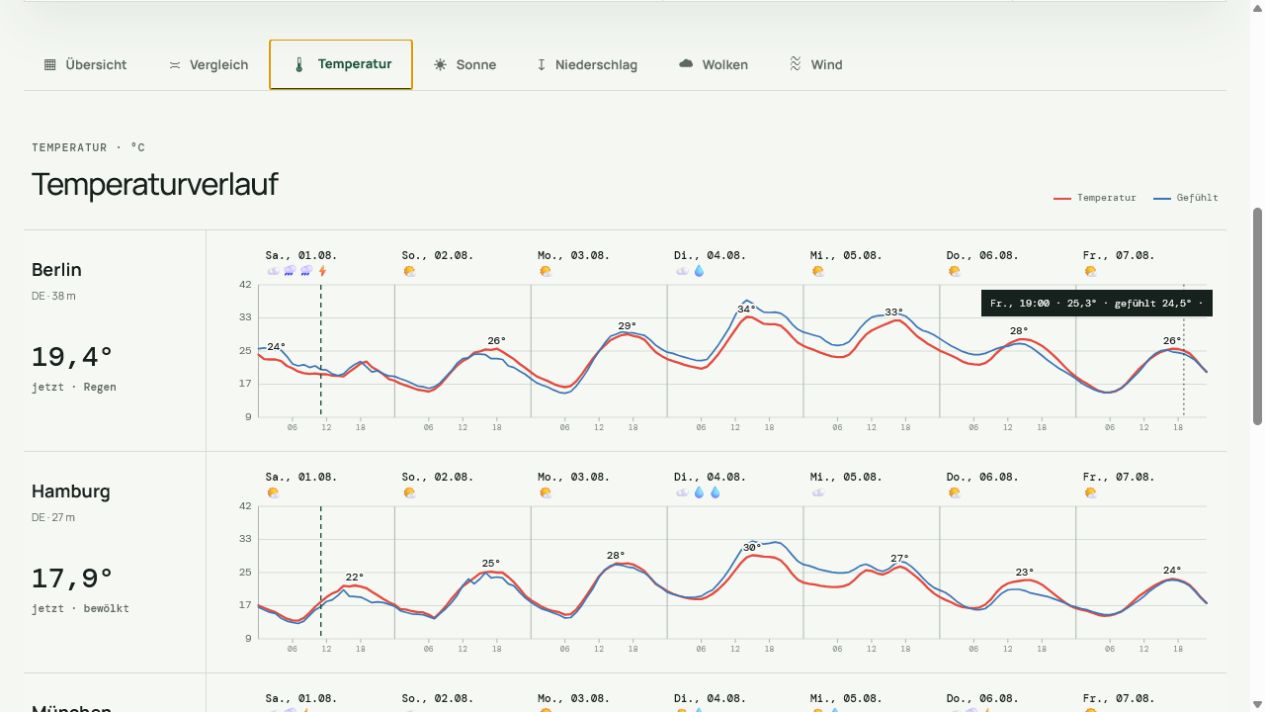
Zeigt den stündlichen Temperaturverlauf für jeden Ort. Neben der gemessenen Lufttemperatur erscheint die gefühlte Temperatur, damit Wind, Feuchtigkeit und Strahlung besser eingeordnet werden können.
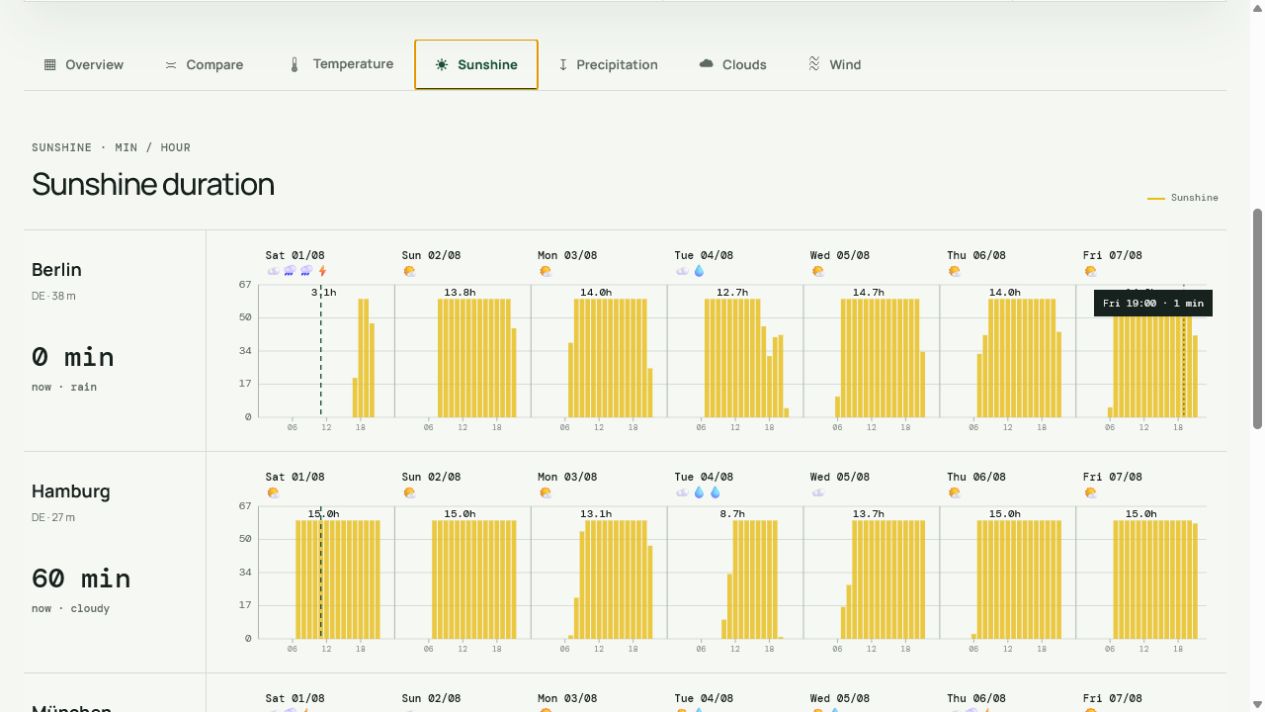
Sonne
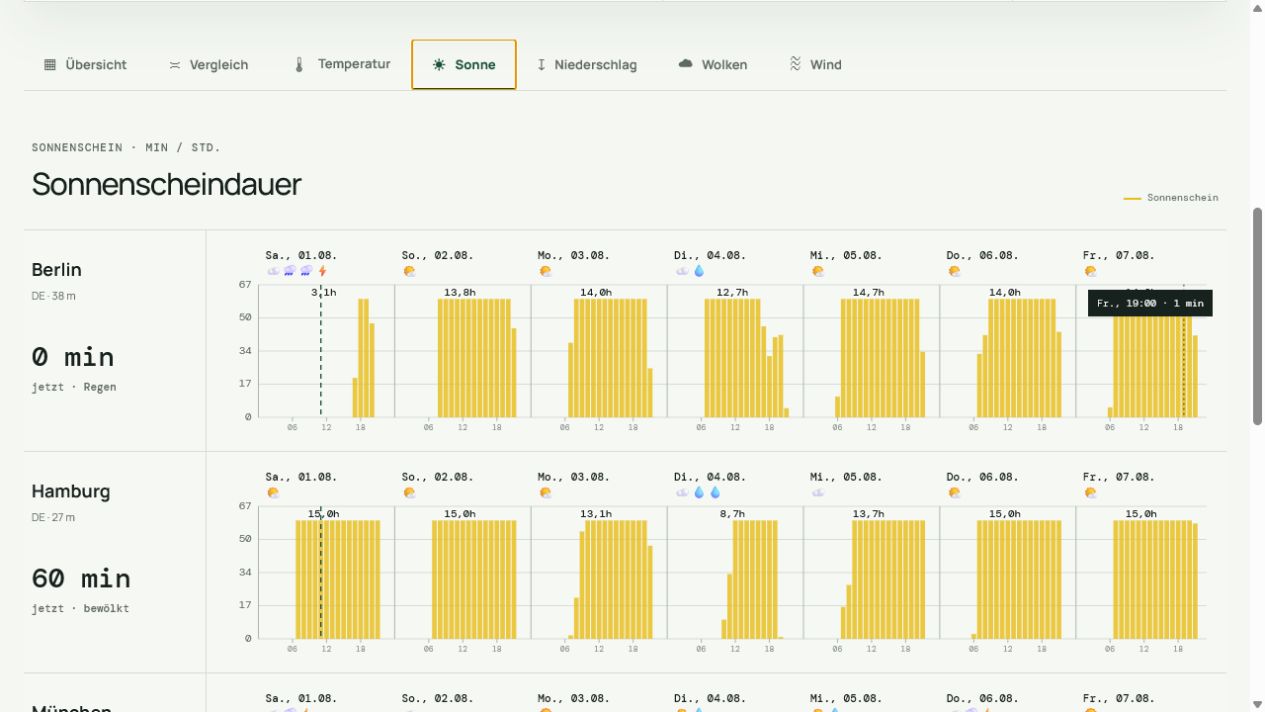
Visualisiert die vorhergesagte Sonnenscheindauer je Stunde. So erkennst du schnell, wann längere sonnige Abschnitte zu erwarten sind und welcher Ort die besten Aussichten bietet.
Niederschlag
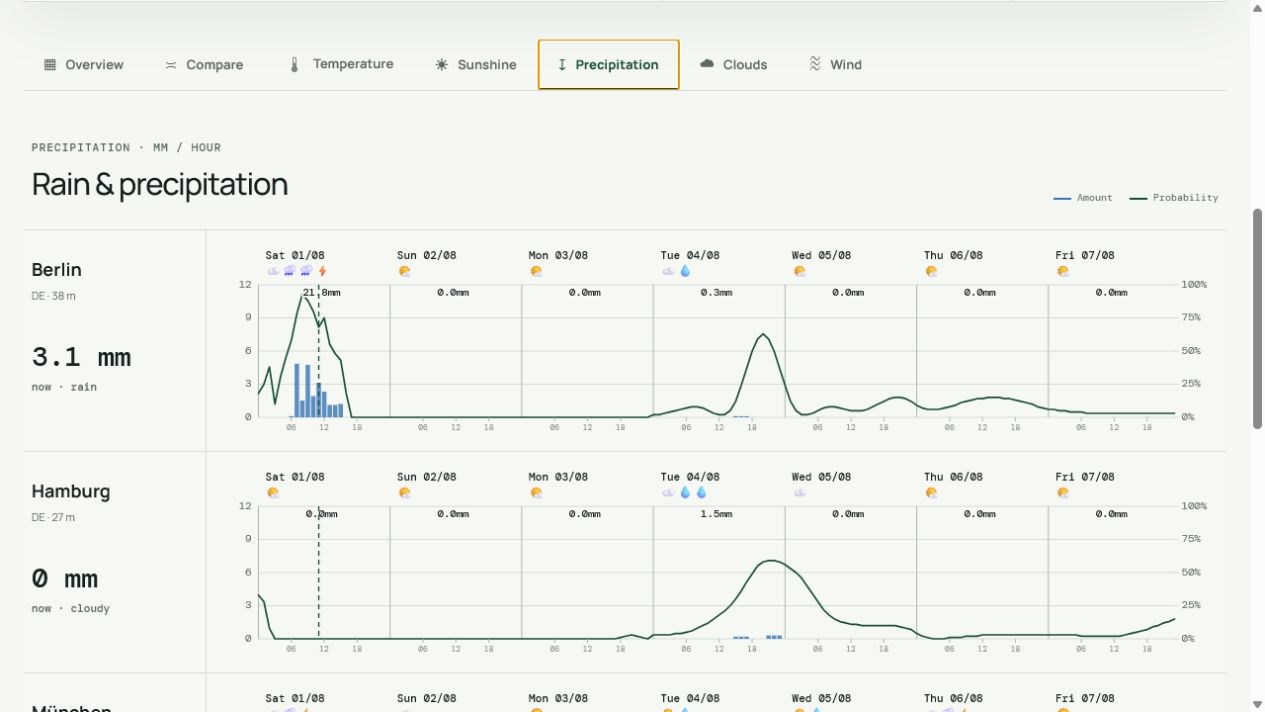
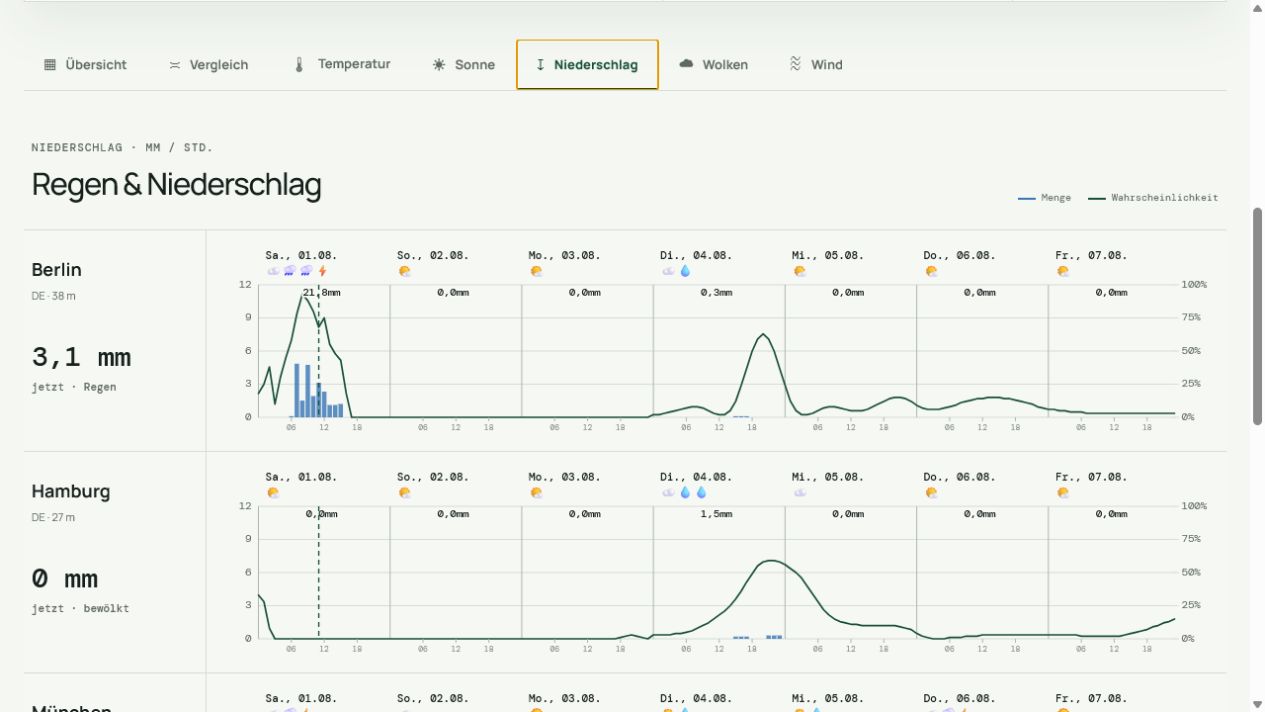
Stellt Niederschlagsmenge und Regenwahrscheinlichkeit stündlich dar. Menge und Wahrscheinlichkeit beantworten unterschiedliche Fragen: wie sicher Regen ist und wie viel voraussichtlich fällt.
Wolken
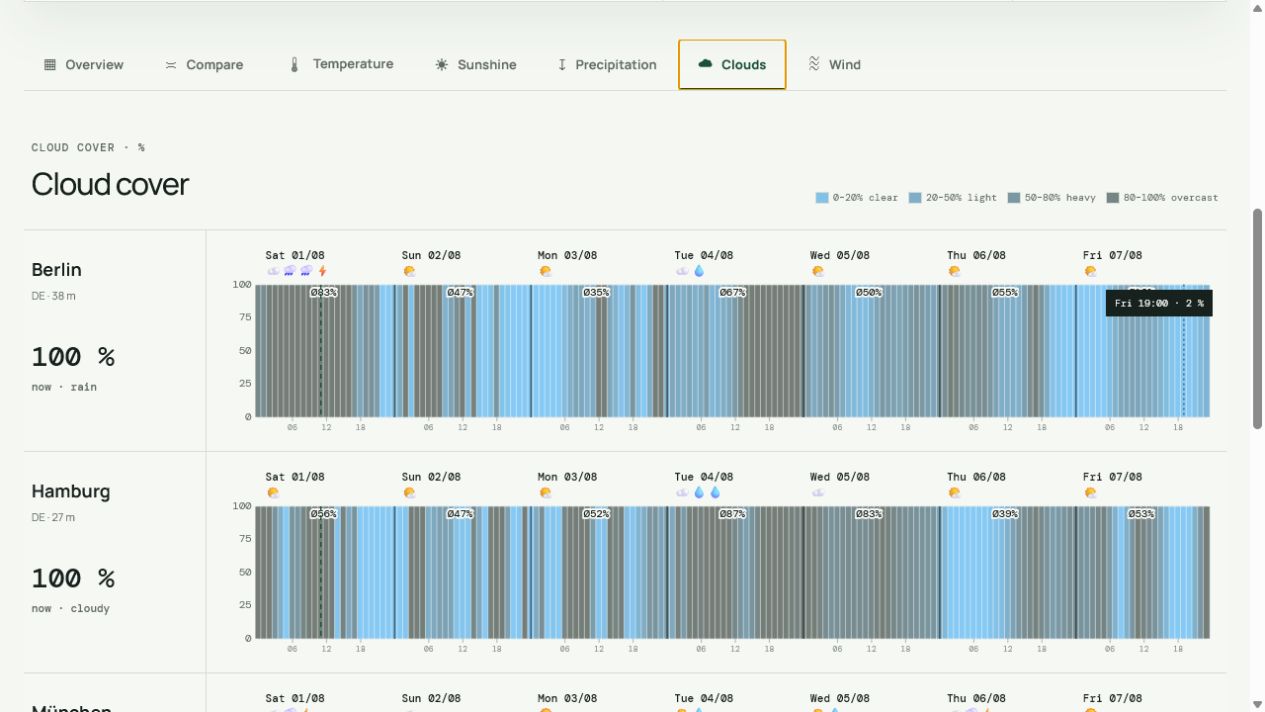
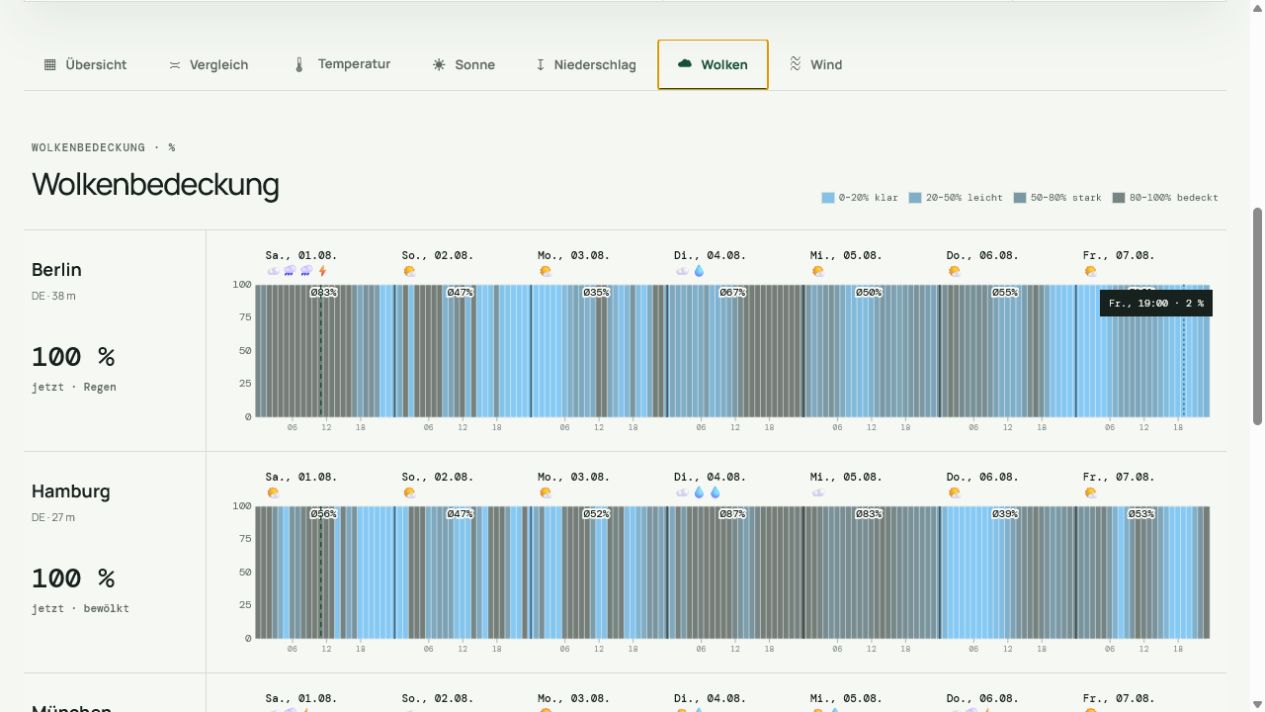
Zeigt den prozentualen Bedeckungsgrad im Tagesverlauf. Niedrige Werte stehen für einen eher klaren Himmel, hohe Werte für starke Bewölkung oder eine geschlossene Wolkendecke.
Wind
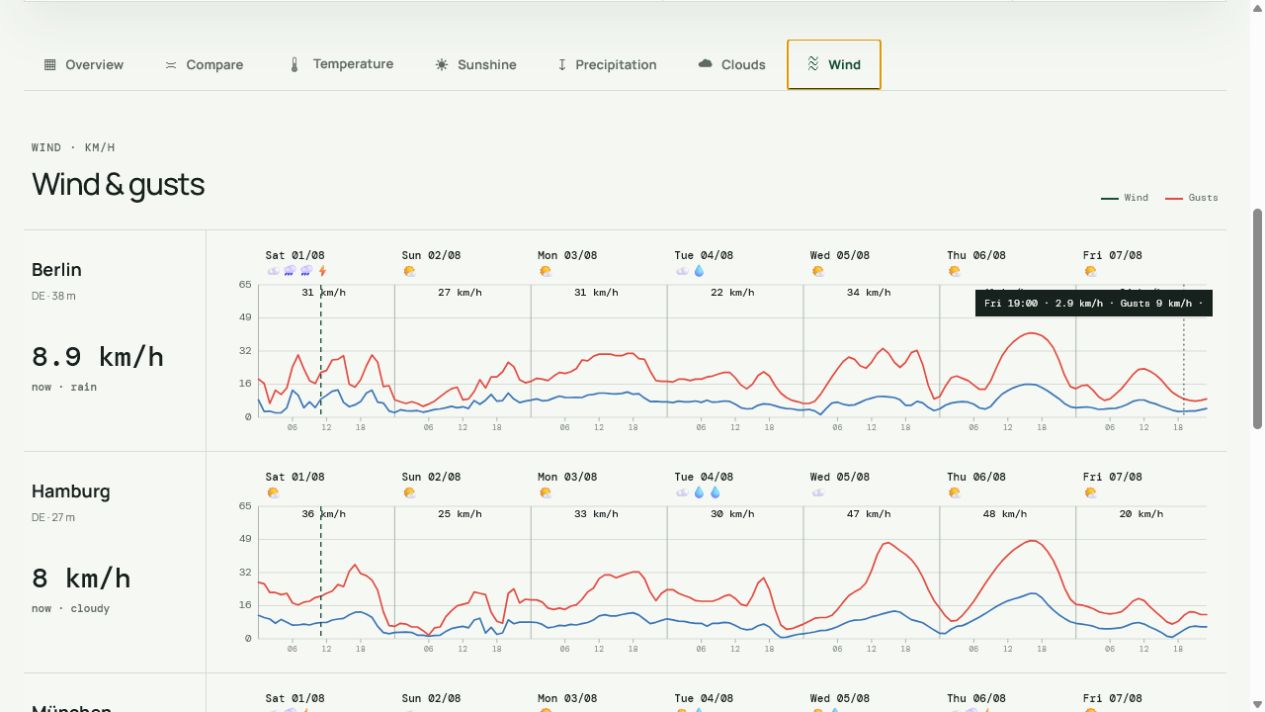
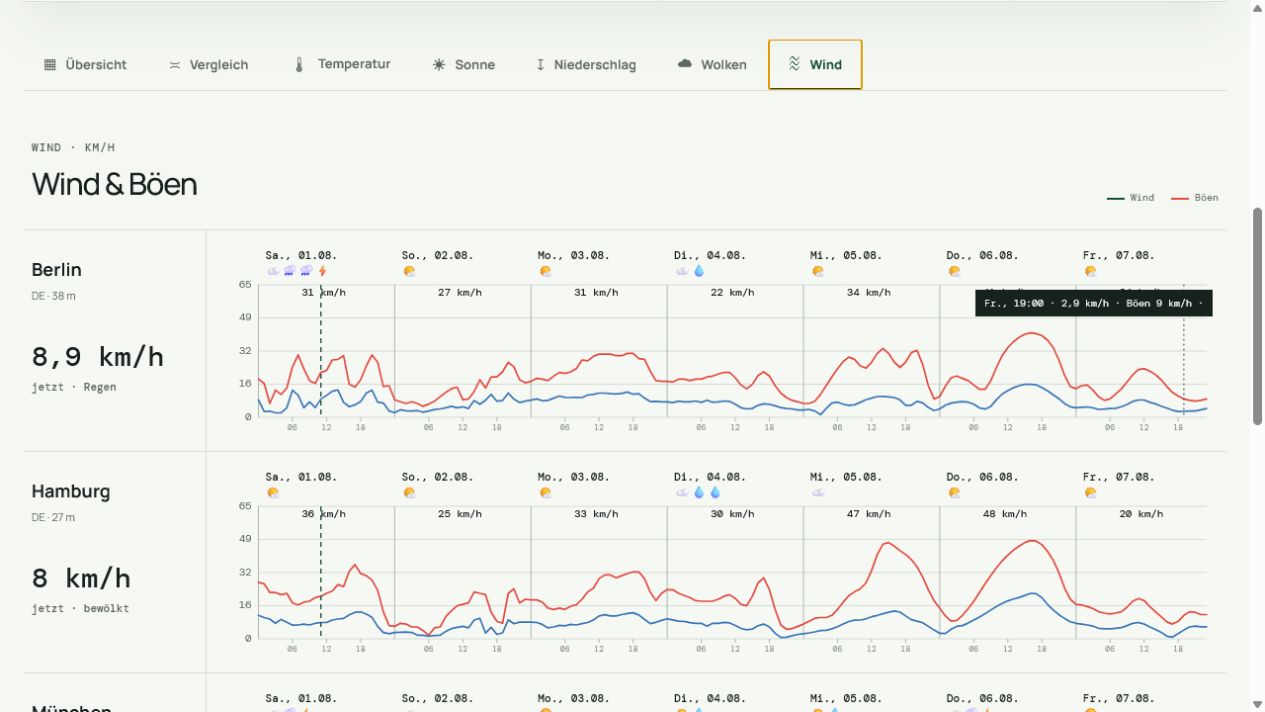
Vergleicht die mittlere Windgeschwindigkeit mit den erwarteten Böen. Die getrennten Kurven helfen, ruhige Phasen und kurze, deutlich stärkere Windspitzen zu erkennen.
03 VORHERSAGEMODELLE
Best Match, ICON, ECMWF und GFS
Best Match
Wählt automatisch eine lokal geeignete Prognose mit möglichst hoher räumlicher Auflösung.
DWD ICON
Das Vorhersagesystem des Deutschen Wetterdienstes eignet sich besonders für Deutschland und Europa.
ECMWF IFS
Ein globales Vorhersagemodell des Europäischen Zentrums für mittelfristige Wettervorhersage.
NOAA GFS
Ein globales Vorhersagemodell der US-amerikanischen Wetter- und Ozeanografiebehörde NOAA.
Unterschiedliche Modelle können zu unterschiedlichen Ergebnissen kommen. Prognosen sind modellbasierte Einschätzungen, keine Wettergarantie und kein Ersatz für amtliche Unwetterwarnungen.
04 HÄUFIGE FRAGEN
FAQ
Welche Wetterdaten kann ich vergleichen?
Temperatur, gefühlte Temperatur, Niederschlag, Sonnenscheindauer, Bewölkung, Wind und Böen für bis zu fünf Orte.
Woher stammen die Daten?
Wetter- und Ortsdaten werden von Open‑Meteo bereitgestellt. Die jeweils gewählte Modellquelle wird in MeteoDeck angezeigt.
Werden meine Orte gespeichert?
Nur wenn du eine Ortsauswahl speicherst – und dann ausschließlich im lokalen Speicher deines Browsers.
Warum unterscheiden sich Modelle?
Modelle nutzen unterschiedliche Auflösungen, Rechenverfahren und Anfangsdaten. Abweichungen sind normal und machen Unsicherheiten sichtbar.